We are sorry, but currently there is no English version of the EVA Calculator application.
Description of the EVA Calculator application
For more advanced users, especially for purpose of internal evaluation, the EVA Calculator appliaction has been developed. It allows in-depth analyses, but it also has some limitations. The main limitation is that users have to provide the software with data on pupils’ examination results and pupils’ characteristics (e. g. information about pupils’ sex, disabilities, SES, etc.) themselves (data are provided as a simple MS Excel or CSV file). Such data can be easily collected by teachers, headmasters and other people involved in the education system, but it is rather impossible for people from outside the system (especially parents). This might be seen as a drawback, but it prevents unqualified people (e. g. journalists) from performing analyses and drawing misleading conclusions from them. Taking into account that Polish schools are afraid of being unfairly rated and that such a fear can be a major obstacle in introducing the VA indicators into education system, we see this limitation as beneficial. The second limitation is that the EVA Calculator is a rather complex software and most users require some training to be able to perform analysis by themselves.
The EVA Calculator provide users with analyses for one-cohort periods and the user can choose the level of analysis on his/her own (e.g. school level, cohort level or class level). For each analysis pupils can be grouped by any variable provided in data (like sex, dyslexia, socio-economic status, level of achievements on entering the school, etc.). This ensures a great flexibility of analyses and enables in-depth analyses of various aspects of school’s work. The available VA indicators include:
- humanities and math&science indicators for lower secondary school schools;
- math indicator for upper secondary schools (separate indicators for general and vocational schools).
Indicators available for upper secondary schools have been limited to math indicator, that is one of two subjects that are compulsory on examinations at the end of upper secondary schooling (called matura). Indicators for the second compulsory subject, i.e. Polish language, were abandoned because of poor psychometric characteristics of examination tests.
There are 8 different types of analyses available in the EVA Calculator:
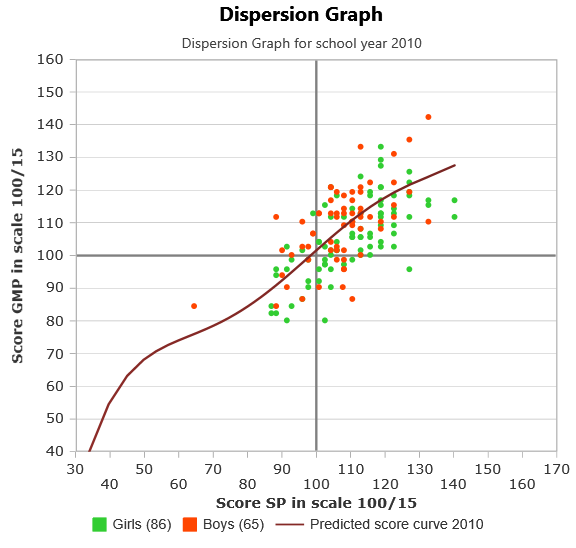
 A dispersion graph, which is the most complicated one. It shows the position of each pupil with “entry examination score” on the X axis and “exit examination score” on the Y axis. The difference on the Y axis between pupil’s position and the line of predicted examination score is the pupil’s residual (formally it is a residual in a regression predicting exit examination score with entry examination score). The mean of those differences over a group of pupils is a EVA for a given group. Different groups are marked in different colors.
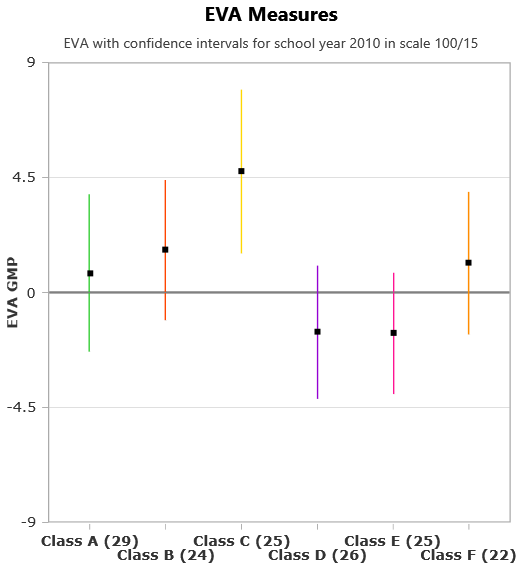
- The EVA measures graph. It is a simple graph displaying confidence intervals for a given EVA indicator for a given groups. It allows the users to easily identify groups of pupils, for whom the difference in EVA statistically significant.
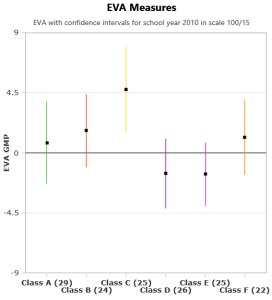
- The average scores graph. This graph is very similar to the EVA measures graph but here the confidence intervals for mean examination scores for a given examination (instead of a given EVA indicator) and for given groups are plotted. It allows the users to easily identify groups of pupils, for whom the difference in the mean examination score is statistically significant.
- The educational potential graph. It is a simple graph displaying the distribution of the “educational potential” in the given groups. There are three levels of “educational potential” distinguished. “Educational potential” of each pupil is based on his/her entry examination score. It allows checking, how pupils are allocated to classes and how strong the segregation is due to the educational potential).
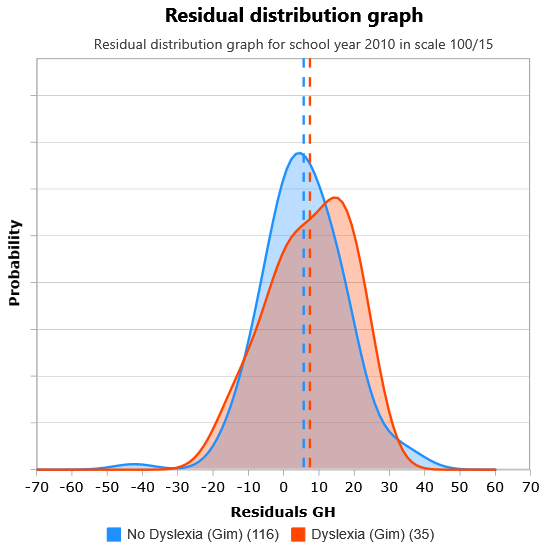
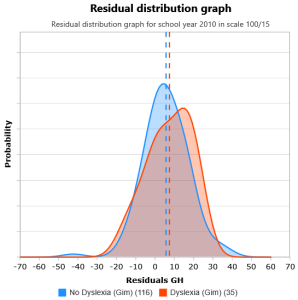 The residual distribution graph, the predicted scores graph and the score distribution graph. All three graphs show the distribution of a given attribute for each given group. The residuals distribution graph shows the distribution of regression residuals for a given EVA indicator; the predicted scores graph shows the distribution of predicted scores for a given examination; and the score distribution graph shows the distribution of real examination scores for a given examination. The mean EVA/predicted score/achieved score for each group is also plotted. Many distributions for different groups of pupils can be shown on one graph. Unusual shapes of distributions allow us to find differences in teaching effectiveness, pupils educational potential, pupils educational needs, etc. between groups and within groups.
- The data table. For pupils grouped by given characteristics (school, cohort, class, sex, dyslexia, etc.), it displays: frequencies of pupils, mean exam scores (on the standardized and raw scales, EVA indicators values and confidence intervals.